
Running the report
Select your location in the top navigation bar. The report runs immediately for today. To see any other period, pick a date range and click Run.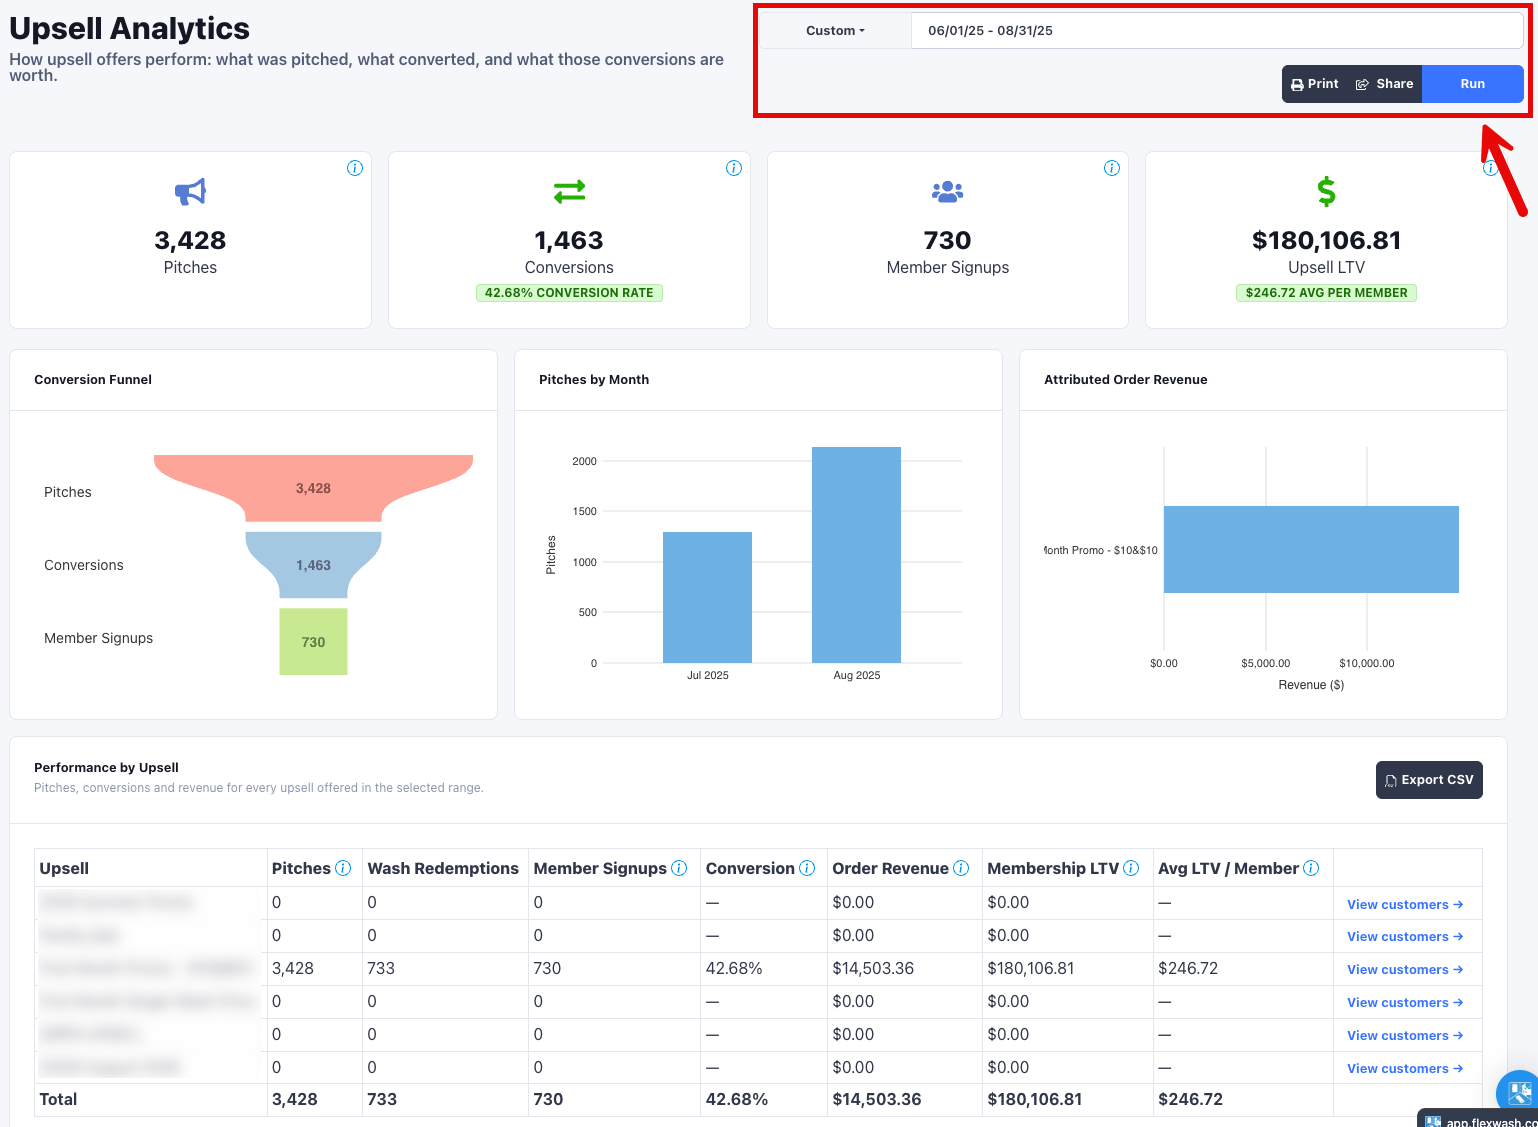
The date range picker opens on Today. Widen it (Last 90 Days, Year to Date,
or a custom range) before you draw conclusions, since a single day rarely holds
enough pitches to be meaningful.
Summary tiles
Four tiles summarize the cohort. Each carries an information icon with the same definition documented here.Quiet upsells and conversion rate
Conversion rate is conversions divided by pitches. Two results surprise people the first time they see them, and both are correct:- A rate above 100%. A price change recorded without a pitch, sometimes called a quiet upsell, converts without ever being pitched. Those conversions land in the numerator with nothing added to the denominator.
- A dash instead of a rate. When nothing was pitched, the rate is undefined rather than zero.
How LTV is calculated
Upsell LTV is the net sum of membership billing on the subscription that signed up on the upsell, from the sign-up onward, accrued to today. Three consequences are worth knowing:- It is not clamped to the date range. The range picks which sign-ups are in the cohort. Their revenue keeps accumulating past the end date, so the same range run again next month reports a higher LTV.
- It is net. The upsell’s own discount is a negative line item on the subscription, so it reduces LTV.
- It stops at a reactivation. If the member later cancels and comes back, billing from the reactivation onward is not credited to the upsell.
Charts
Three charts sit below the tiles.- Conversion Funnel stacks Pitches, Conversions, and Member Signups. It is a funnel by shape only: quiet upsells can push conversions above pitches, so the stages are not guaranteed to shrink as you go down.
- Pitches by Month plots pitches per calendar month.
- Attributed Order Revenue ranks the top eight upsells by attributed order revenue, largest at the top. Upsells with no attributed revenue are left out, so this chart can be shorter than the table below it.
Performance by Upsell
The table breaks pitches, conversions, and revenue out for every upsell offered in the selected range.
A bold total row closes the table. The total Conversion is recalculated from the
totals rather than averaged across rows.
Order Revenue and Membership LTV answer different questions and should
not be added together. Order Revenue is what rang up at the register on the
attributed orders. Membership LTV is recurring billing those sign-ups have
produced since, and it keeps growing after the range closes.
View customers
Each row has a View customers link. It opens the customer list filtered to the distinct customers who signed up for a membership on that upsell, at the selected car washes, inside the selected date range. The list shows name, email, phone, and vehicle plates, sorted by most recent sign-up. Click any customer to open their profile, or use the CSV button to export the whole cohort rather than the page on screen.The drill-in covers member sign-ups only. Customers who redeemed the upsell on a
single wash are counted in Wash Redemptions but are not part of this list.
Exporting
Export CSV in the table header downloads one row per table row, with the same columns plus a Deleted flag. The file covers every upsell in the table, not just the current page, and is named for the range you ran, for exampleupsell-analytics-2026-06-01-to-2026-08-31.csv.