
Running the report
Select your location in the top navigation bar. The report runs immediately for today. To see any other period, pick a date range and click Run.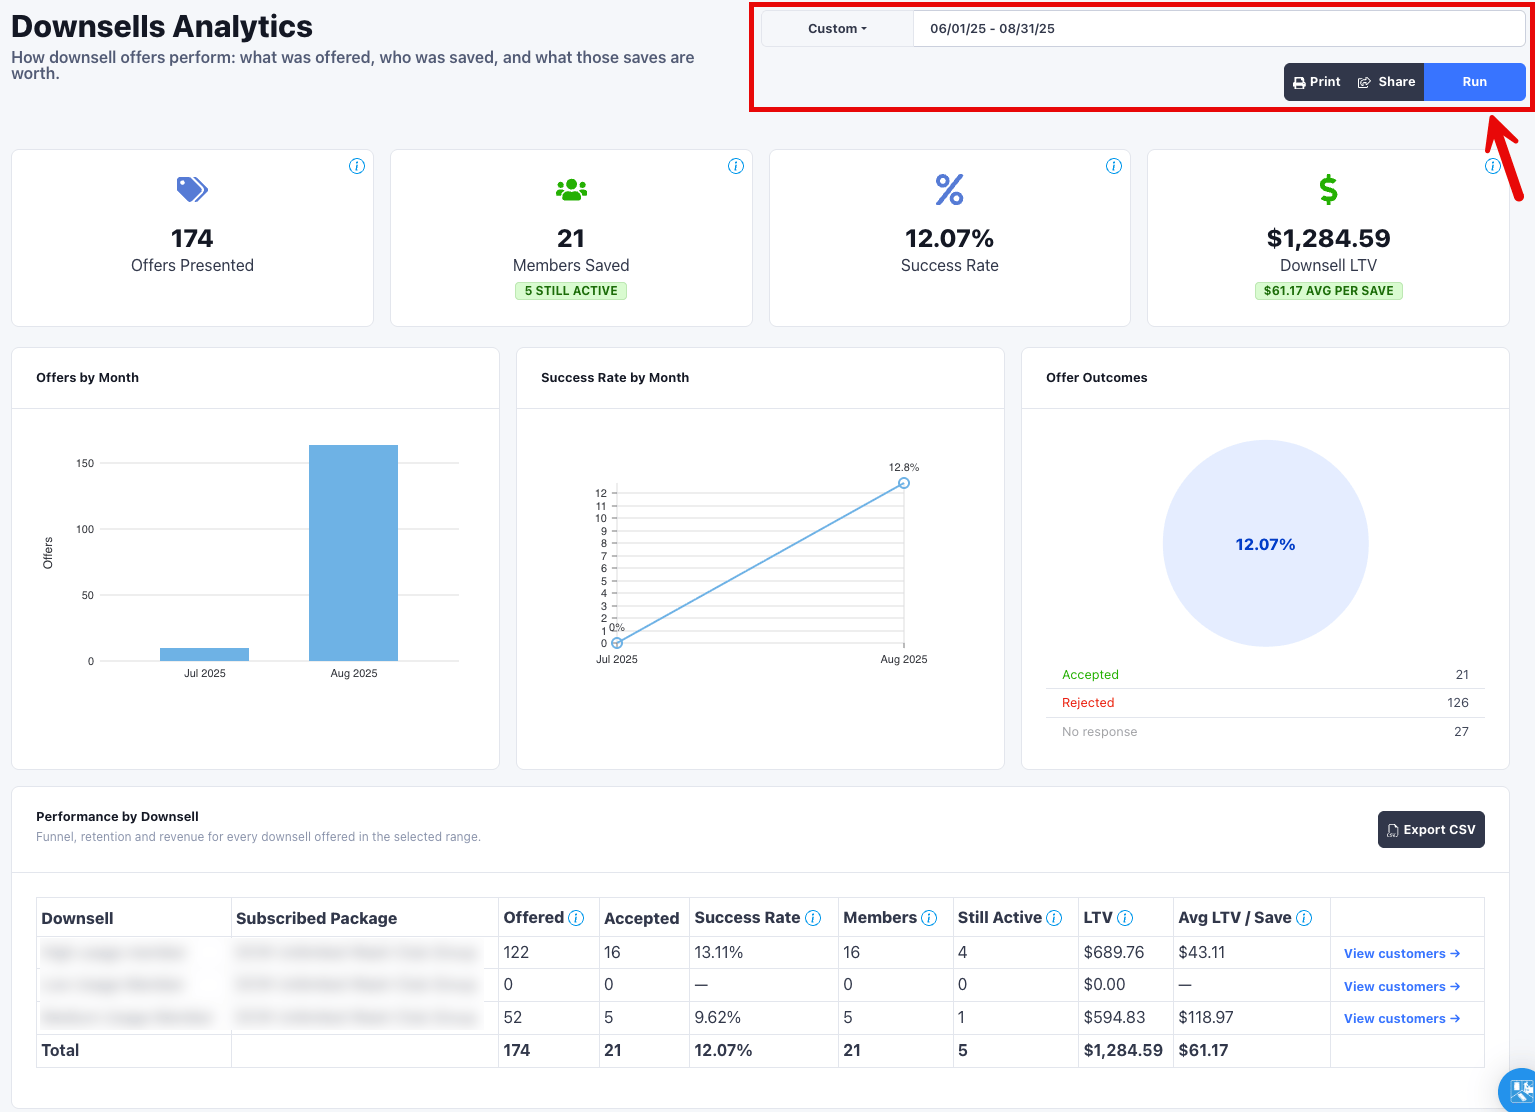
Downsell activity over a single day is usually thin, so the default view often
looks empty. Widen the range to Last 90 Days, Year to Date, or a custom range
before you read anything into the numbers.
Summary tiles
Four tiles summarize the cohort. Each carries an information icon with the same definition documented here.How Success Rate is calculated
Offers that a member never responded to stay in the denominator. That is deliberate: it keeps this rate comparable to the lifetime success rate that used to appear on the Downsells configuration page. A range with many pending offers reads lower than a range where every offer got an answer.How LTV is calculated
Downsell LTV is the net sum of membership billing on the saved subscription, from the moment the offer was accepted, and it accrues to today. Three consequences are worth knowing:- It counts membership billing only. Wash and retail purchases by a saved member are not included, only their recurring membership charges.
- It is not clamped to the date range. The range picks which saves are in the cohort. The revenue keeps accumulating past the end date, so the same range run again next month reports a higher LTV.
- Discounts pull it down, refunds do not. The discount the downsell granted is a negative line item on the subscription, so it reduces LTV, which is the point: the number reflects what the save actually earned. Refunds are not deducted, and house accounts are not excluded.
- It stops at a reactivation. If a saved member later cancels and comes back, billing from the reactivation onward is not credited to the downsell.
This is not the same figure as the Membership LTV
report. That report measures a member’s full lifetime value. Downsell LTV
measures one subscription from the moment a save offer was accepted.
Charts
Three charts sit below the tiles.- Offers by Month plots offers presented per calendar month.
- Success Rate by Month plots the monthly accepted share as a percentage.
- Offer Outcomes breaks the cohort into accepted, rejected, and no response. The center of the ring repeats the overall success rate.
Performance by Downsell
The table breaks the funnel, retention, and revenue out for every downsell offered in the selected range.
A bold total row closes the table.
The Members total is a distinct count across the whole report, not the sum
of the column above it. A customer who was offered two different downsells
counts once in the total and once in each row. The same applies to the Members
Saved tile.
View customers
Each row has a View customers link. It opens the customer list filtered to the distinct customers who accepted that downsell, at the selected car washes, inside the selected date range. The list shows name, email, phone, and vehicle plates, sorted by most recent acceptance. Click any customer to open their profile, or use the CSV button to export the whole cohort rather than the page on screen.Exporting
Export CSV in the table header downloads one row per table row, with the same columns plus a Deleted flag. The file covers every downsell in the table, and is named for the range you ran, for exampledownsells-analytics-2026-06-01-to-2026-08-31.csv.