> ## Documentation Index
> Fetch the complete documentation index at: https://docs.flexwash.com/llms.txt
> Use this file to discover all available pages before exploring further.
# Promotions
> This tool shows you a breakdown of the promotions sold by your employees.
### Promotions
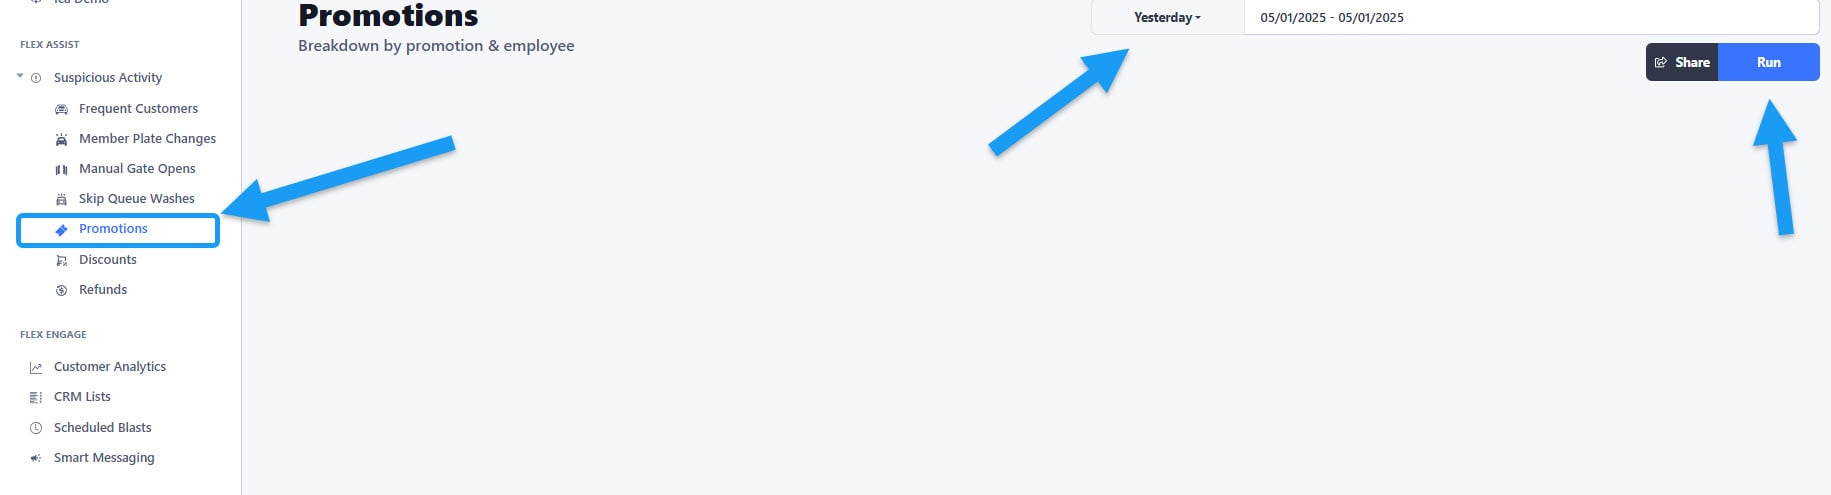 You can find the option under the Flex Assist section of your sidebar menu on the left. Make sure you select a date range and then click the "Run" button to generate the report.
### Revenue & Percentage
You can find the option under the Flex Assist section of your sidebar menu on the left. Make sure you select a date range and then click the "Run" button to generate the report.
### Revenue & Percentage
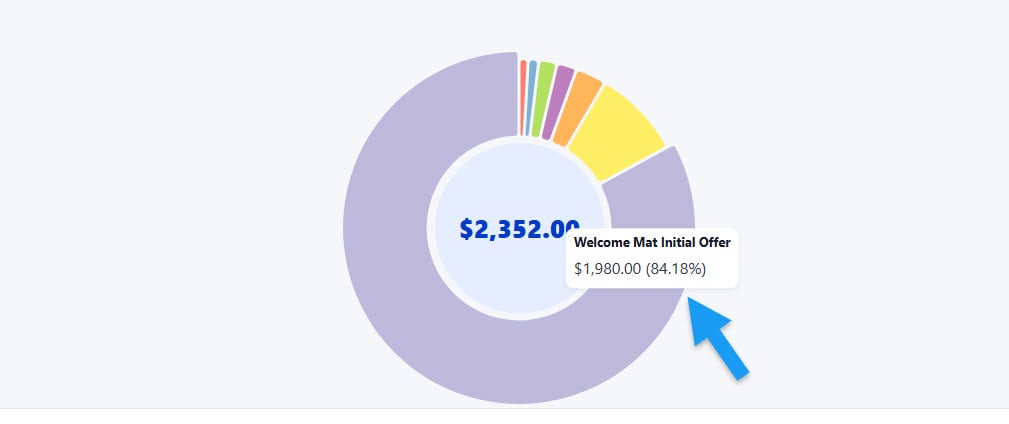 First you will see a graph showing the total revenue generated by the promotions that have been sold during the selected date range. The data is also broken down in the graph by each promotion, you can get the details of each by hovering your mouse over each section. On the example above, we can see that 84.18% of the total revenue generated by promotions came from the "Welcome Mat Initial Offer" promo.
### Breakdown by Employee
First you will see a graph showing the total revenue generated by the promotions that have been sold during the selected date range. The data is also broken down in the graph by each promotion, you can get the details of each by hovering your mouse over each section. On the example above, we can see that 84.18% of the total revenue generated by promotions came from the "Welcome Mat Initial Offer" promo.
### Breakdown by Employee
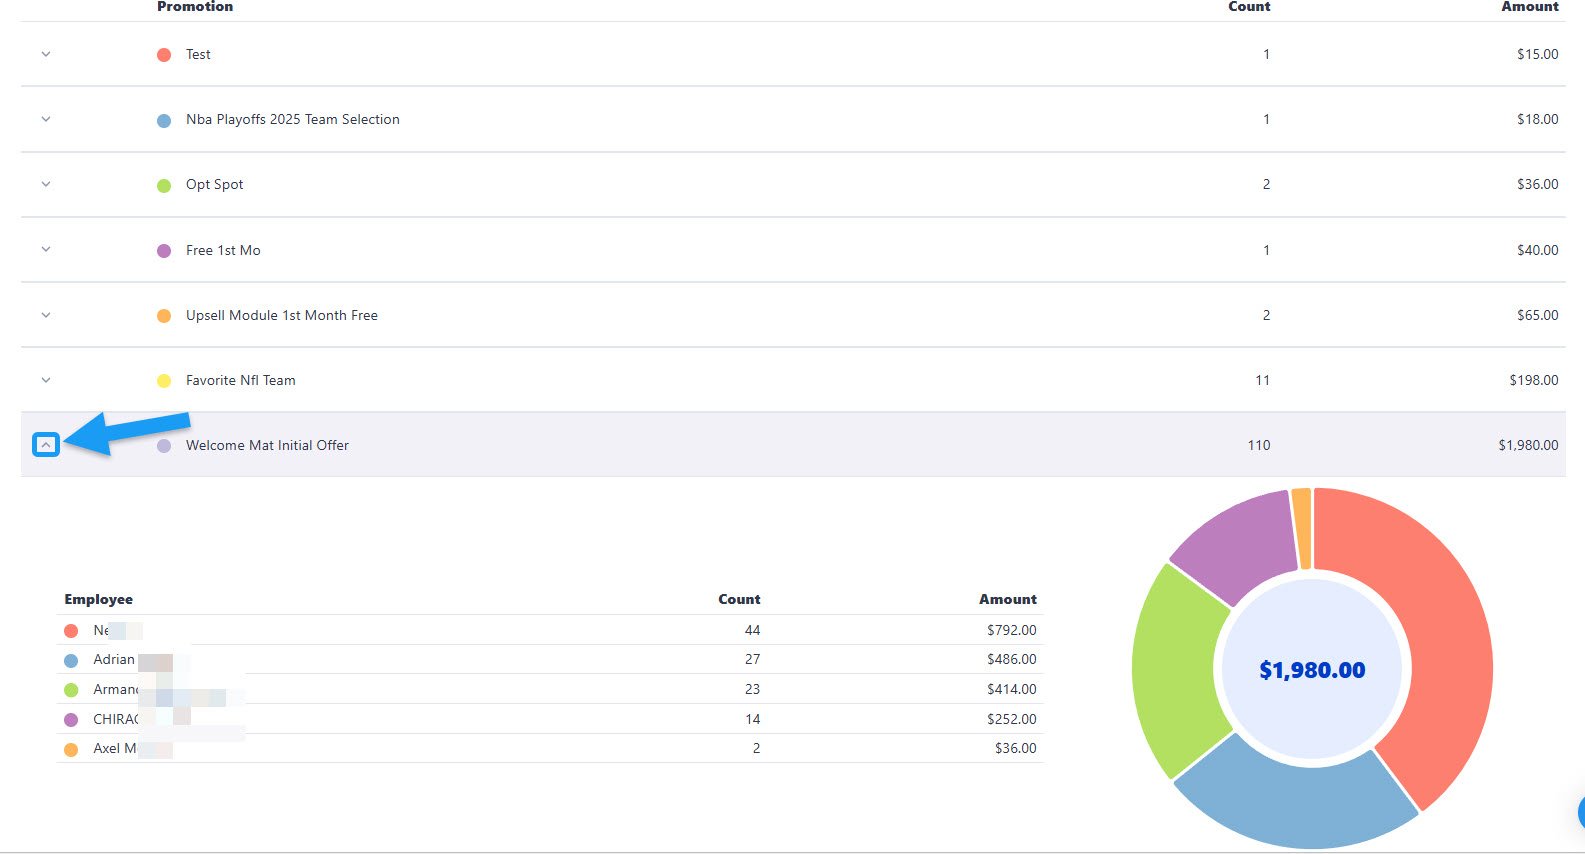 To get a detailed breakdown of the sales of promotions by Employee, click on the arrow located on the left side of each promotion. This will open a table and a graph with the statistics.